Download a PDF version of this report
Executive Summary
Background: More than 6,300 Medicare-certified ambulatory surgery centers (ASCs) provide outpatient services to Medicare beneficiaries.1 In 2024, Medicare paid ASCs, on average, 62% of hospital outpatient department (HOPD) rates for the same procedures, meaning that every time a procedure for a Medicare beneficiary was performed in an ASC instead of an HOPD, the Medicare program saved money. We report estimates of savings to the fee-for-service (FFS) Medicare program from use of ASCs instead of HOPDs for 2019 through 2024 and then project savings for 2025 through 2033.
Since 2019, the share of Medicare beneficiaries enrolled in Medicare Advantage (MA) has increased from 37% to 50%.2 However, little is known about ASC utilization in MA. Given its growing importance, we sought to illuminate the patterns of ASC utilization in MA as compared to FFS.
Methods: We used Medicare claims and other publicly available data to examine the volume of procedures performed at ASCs, compare payments to HOPDs and ASCs, and develop assumptions on future growth. We estimated historical and potential future savings by: (1) estimating spending for ASC billed services using HOPD payment rates instead of ASC payment rates and (2) comparing this "hypothetical" aggregate spending to actual ASC spending. We report total savings and savings by Current Procedural Terminology (CPT) groups of services (using HCPCS codes). We also highlight some specific service groups representing surgeries newly performed in ASC or otherwise noteworthy procedures. For the comparison of MA and FFS, we used MA encounter files and Medicare FFS claims data and identified the site of service (ASC vs. HOPD) to calculate counts of surgeries. This additional analysis includes the breakdown of those receiving ASC procedures by dual enrollment status, age group, and service group.
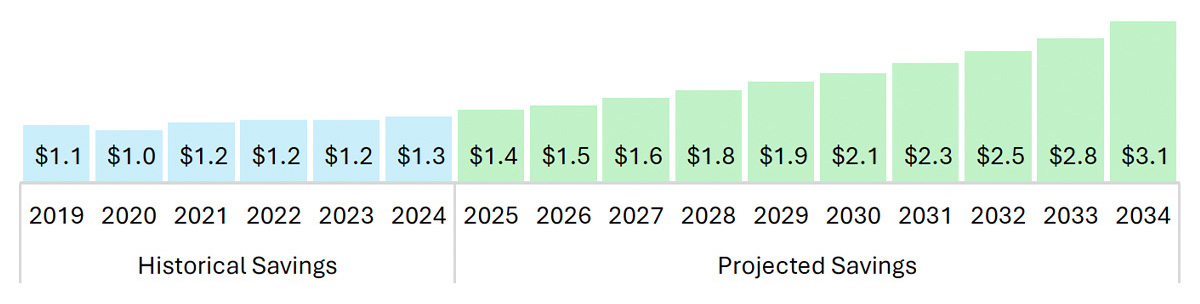
Results: During the period from 2019 to 2024, the total Medicare savings generated by ASCs was $27.9 billion (Figure ES1). The projected total Medicare savings generated by ASCs from 2025–2034 is estimated to be $84.8 billion. Cataract surgery and colonoscopies continue to be major services for ASCs, with additional growth seen in percutaneous laminectomy, total knee replacement, and cardiac catheterization.
Figure ES1. Total Historical and Projected Medicare Savings in FFS (2019 – 2034), in billions
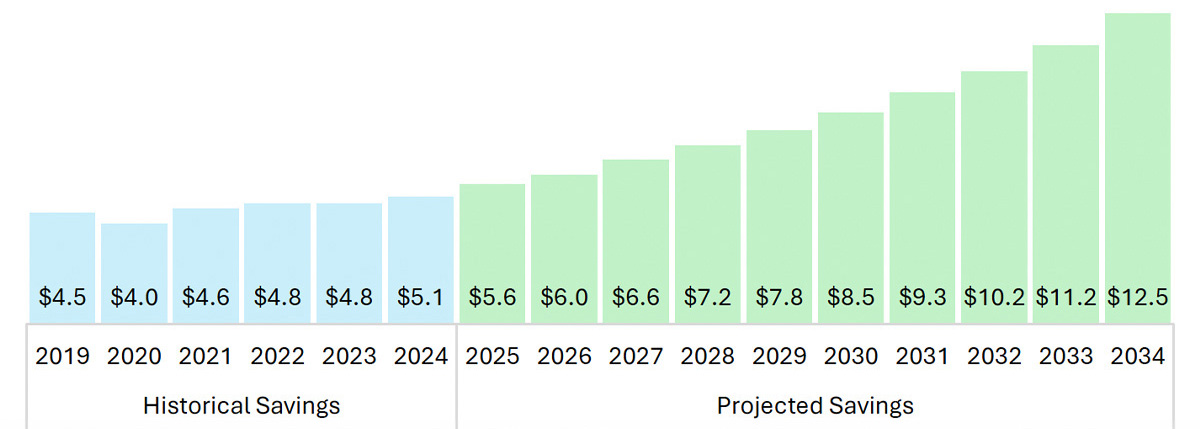
Source: KNG Health analysis of Standard Analytic File (SAF).
In 2024, ASCs performed roughly 7 million procedures for Medicare beneficiaries each year. This volume includes a significant share of essential services, such as 18.0% of cataract surgeries (HCPCS 66982 and 66984) and 13.4% of colonoscopies (HCPCS 45380 and 45385). The 2024 volume share for other specific surgeries highlighted in this report are total knee replacements (HCPCS 27447) at 0.6%, cardiac catheterizations (HCPCS 93458) at 0.2%, and percutaneous laminectomies (HCPCS 0275T) at 0.2%.
In the comparison of FFS to MA, we found that rates of ASC shares compared to HOPD shares were similar for MA and FFS across age groups. In the dual-eligible beneficiary group, ASC shares were slightly higher in MA than FFS across age groups. Eye and ocular surgeries were the highest procedure category performed in ASCs across both MA and FFS.
Conclusion: As a lower-cost setting, ASCs offer substantial savings to the Medicare program by focusing on a stable group of high-volume procedures. Policymakers should continue to monitor the growing payment disparity between ASCs and HOPDs, as low Medicare reimbursement may discourage use of ASCs. In addition, policymakers should continue policies that incentivize safe migration of eligible procedures to the ASC setting to achieve program and beneficiary savings.
Introduction & Background
This report evaluates the impact of ambulatory surgery centers (ASCs) on Medicare spending. Since the first facility opened in 1970, the landscape has expanded to more than 6,300 Medicare-certified ASCs nationwide. Modern medical advancements—particularly in anesthesia and minimally invasive techniques—have enabled these facilities to perform a broad spectrum of procedures with high safety standards. By operating with lower overhead and greater efficiency than hospital outpatient departments (HOPDs), ASCs offer a cost-effective alternative on average, costing Medicare 62% of HOPD rates for the same procedures.3
We analyze fee-for-service (FFS) claims from 2019 to 2024 to determine savings achieved by the Medicare program due to surgical and diagnostic procedures having been performed in ASCs instead of HOPDs. In addition, the report seeks to project future savings that could be achieved from 2025 to 2034 by applying growth rates for surgical volume and ASC market share for major Current Procedural Terminology (CPT) code ranges. This analysis updates a 2020 study, Reducing Medicare Costs by Migrating Volume from Hospital Outpatient Departments to Ambulatory Surgery Centers, which estimated savings from 2011 to 2018.5
The share of Medicare receiving benefits through a private health plan in Medicare Advantage (MA) has increased from 37% in 2019 to 50% in 2024.6 While MA's unique payment structures often result in distinct care patterns and greater incentive for cost savings, its impact on ASC utilization remains under-researched. Given its growing importance, we sought to illuminate the patterns of ASC utilization in MA as compared to FFS.
Although more than half Medicare beneficiaries are enrolled in MA, little is known about ASC usage among MA beneficiaries. This report includes the share of outpatient surgical services provided in ASCs for FFS Medicare and MA beneficiaries – with breakdowns by age and dual enrollment status.
Data & Methods
The complete list of data sources and full methodology can be found in Appendix A.
Data Sources
We used Medicare FFS claim files to identify procedure-level paid amounts, outpatient procedure volumes, and the share of outpatient procedures performed at ASCs. Future growth in the Medicare population was estimated using census data, the Medicare Board of Trustees Annual Report, and CMS-reported Medicare Advantage (MA) penetration rates. HCPCS were categorized into CPT groups following the Current Procedural Terminology created by the American Medical Association.7 In addition, to better understand the impact of recently added procedures, we looked at the following high-volume procedures: cataract surgery, colonoscopy, total knee replacement, cardiac catheterization, and percutaneous laminectomy.
Past Savings
For each year from 2019 to 2024, we estimated ASC savings for each procedure by comparing the average HOPD claims paid amount with the average ASC payment. By using the real claims paid amount, rather than the reimbursement rates, we accounted for the complexity of the Medicare ASC and HOPD payment systems, including the bundled payment structures.
Future Savings
The projection of ASC savings in FFS required assumptions regarding the growth of outpatient surgical volume per enrollee, MA penetration rates, and the ASC share of outpatient surgeries. Using 2019 to 2024 data, we calculated the average annual growth rates in outpatient volume per enrollee and the ASC share for each HCPCS code range. Using 2024 outpatient volume as a baseline, we applied HCPCS level annual growth rates to project future outpatient volume and ASC share. The baseline outpatient volume per enrollee was stratified by age, gender, and race to match our population projections. Using the stratified outpatient volume and 2024 Medicare payments as a baseline, we calculated payment rates for future years. To incorporate current regulations, 2024 ASC spending was inflated by multiplying the growth in the CMS Inpatient Hospital Market Basket Index (IHMBI) through 2026, and then the Urban Consumer Price Index for 2027 to 2034. HOPD spending was inflated by multiplying the 2024 HOPD spending by the growth in the IHMBI for 2025 to 2034. For each procedure, the savings were estimated using the difference between the projected HOPD and ASC payments.
ASC Share in MA vs. FFS
To estimate the share of procedures performed in ASCs and HOPDs across the MA and FFS populations, we used MA encounter data, Medicare FFS claims, and the Medicare Beneficiary Summary File (MBSF). Beneficiaries were classified as MA or FFS based on the claim file type, and procedures were classified by the site of service. Due to the difference in the availability of data and variables, identification of ASC services for FFS and MA beneficiaries varied slightly.
Results: Historical and Projected Savings
Past Savings
Rise in Total Historical Savings. During the six-year period from 2019 to 2024, the total FFS Medicare savings generated by procedures being performed in ASCs, instead of HOPDs, was $27.9 billion (For full details, see Appendix B – Table 1). Total annual savings grew by 12.6%, from $4.5 billion in 2019 to $5.1 billion in 2024 (Figure 1). Between 2011 and 2024, total annual savings grew by 63% from $3.1 billion to $5.1 billion.
Figure 1: Total Historical Savings in FFS (2011 – 2024), in billions
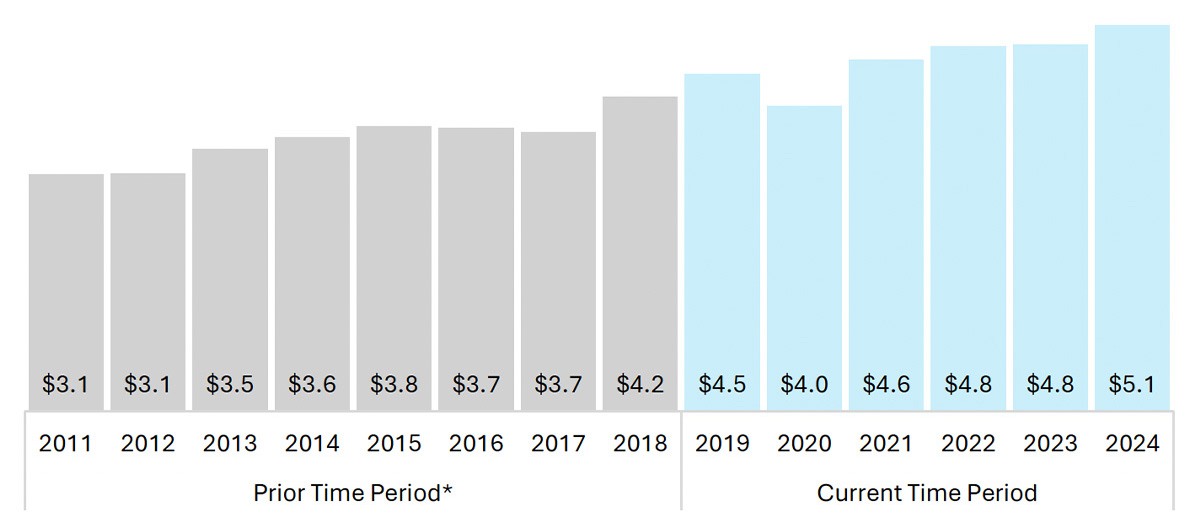
Source: KNG Health analysis of Standard Analytic File (SAF). *Historical savings for years 2011 – 2018 are from the prior ASC-HOPD analysis conducted by KNG Health, found here: https://www.ascassociation.org/asca/about-ascs/savings/medicare-cost-savings/reducing-medicare-costs
Pandemic Disruptions. Total annual savings saw a 9.6% dip from 2019 to 2020, as both ASC and HOPD volume dropped due to the COVID-19 pandemic. The drop in 2020 ASC volume occurred across most CPT categories, with the largest drops seen in surgical procedures on the: (1) eye and ocular adnexa (-444,020, -21.4%); (2) digestive system (-432,780, -21.4%); and (3) nervous system (-383,500, -20.1%). In 2021, savings stabilized from the impacts of the COVID-19 pandemic and were 4.1% higher relative to 2019 (Figure 1). This trend is corroborated by MedPAC's report, which states ASCs saw a surge in 2021 that raised volume of ASC surgical procedures per FFS beneficiary to above pre-pandemic levels.8
CPT Groups. From 2019 to 2024, the largest share of past savings come from eye and ocular surgeries (37.0%) due to the amount of cataract surgeries completed in ASCs. The second largest category is the digestive system that accounts for 16.1% of the total savings. The share of past savings for both eye and ocular surgeries and the digestive system has been relatively stable throughout the time period. In calendar year (CY) 2020 Medicare finalized the addition of total knee replacement (otherwise known as total knee arthroplasty) to the ASC Covered Procedures List.9 The introduction of total knee replacement in ASCs has led to large increases in realized savings for the musculoskeletal CPT group (Figure 2).
Figure 2. Total Historical Savings in FFS by CPT Group (2019 – 2024), in billions
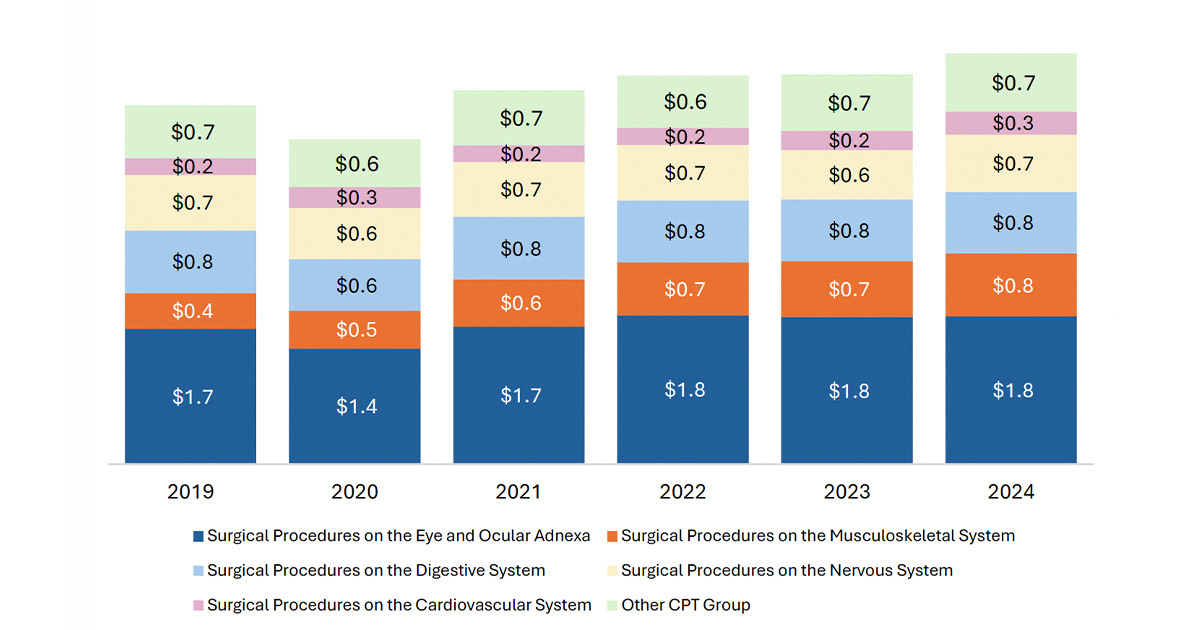
Source: KNG Health analysis of Standard Analytic File (SAF).
Future Savings
Growth in Projected Savings. Beginning in 2025, projected savings from providing services in an ASC rather than a HOPD are expected to increase each year on average by 9.3% until 2034 (Figure 3). The savings are calculated using a combination of the HCPCS level growth rate in the ASC share of surgeries and the disparity between the payments for HOPDs and ASCs. Over the course of the 10-year period, FFS Medicare is expected to save $84.8 billion in total, with the fastest growth in savings being for Category III Codes (HCPCS 0042T to 1025T) (For full details, see Appendix B – Table 2).
Figure 3: Total Historical and Projected Medicare Savings in FFS (2019 – 2034), in billions
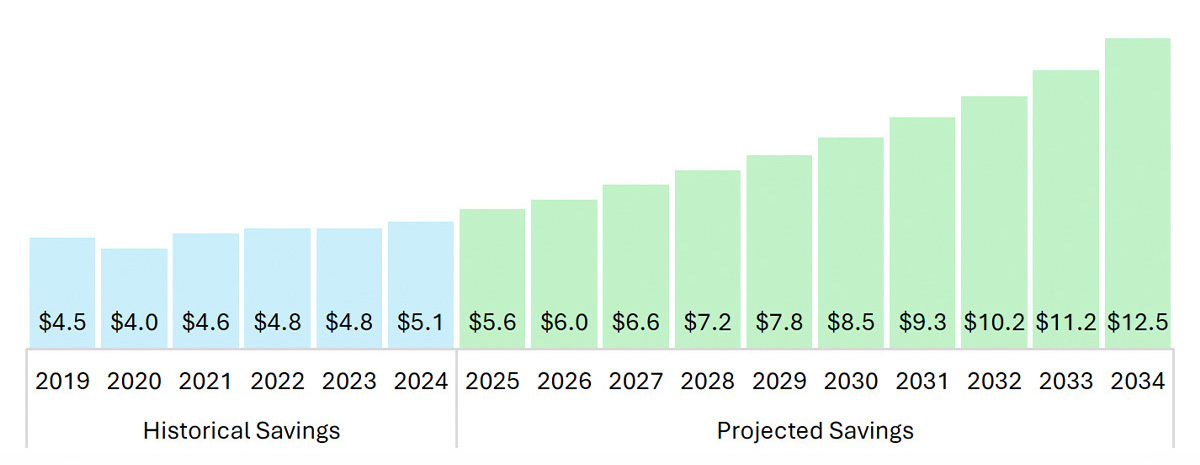
Source: KNG Health analysis of Standard Analytic File (SAF).
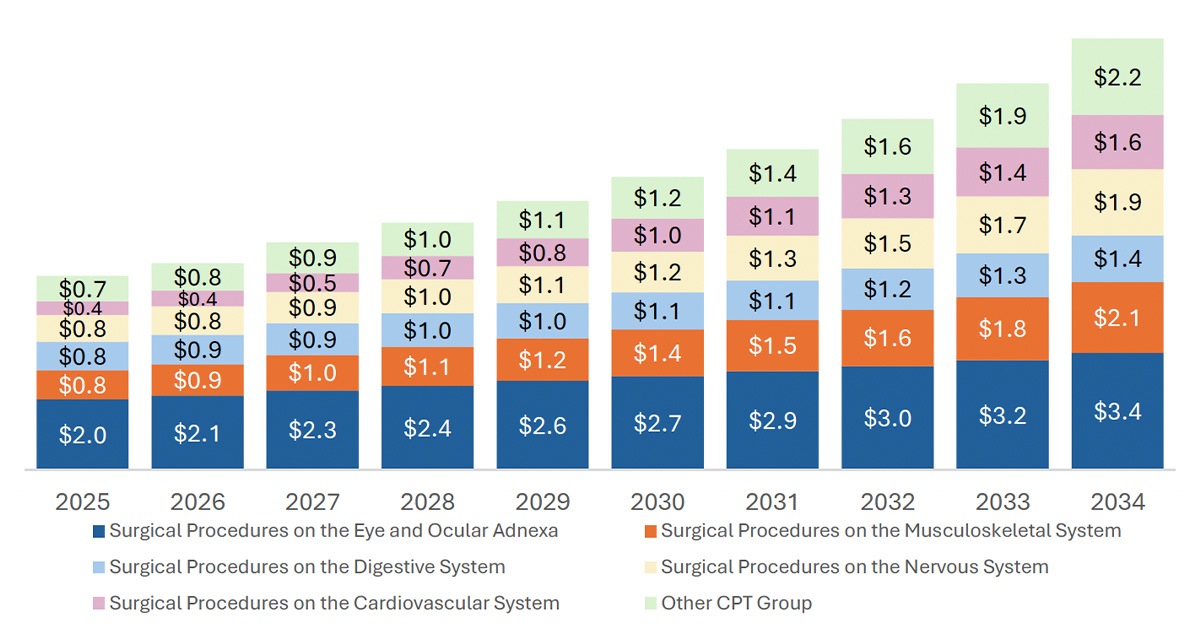
CPT Groups. We project growth in savings across all CPT categories. From 2019 to 2034, the top five CPT groups (Figure 4) account for an average of 85.6% of total savings. Within the top five CPT groups for highest total savings, realized savings for the cardiovascular system are projected to increase the most (302%) from $0.39 billion in 2025 to $1.57 billion in 2034 (Figure 4). We see similar patterns for the past savings (Figure 2). There is also major growth in Category III Codes. The growth in percutaneous laminectomy is the main driver in the overall savings for the Category III Codes CPT group, as the savings for percutaneous laminectomy are 77.6% of the total Category III Codes savings in 2025, but grows to 99.3% of the total Category III Codes savings by 2034. The savings for Category III Codes are expected to grow from $0.03 billion in 2025 to $0.73 billion in 2034 (Figure 4).
While savings for eye and ocular adnexa remains the highest savings by value, the savings are projected to increase slowly overtime compared to the other categories. From 2019 to 2024, savings for eye and ocular adnexa counted for 37% of the total savings. By 2034, it is projected to account for only 27% of the total savings (an average of 31.4% over the 10-year period). This contrasts with the savings for cardiovascular system, which are projected to increase from 6.9% of total savings in 2025 to 12.5% of total savings by 2034.
Figure 4: Total Projected Savings in FFS by CPT Group (2025 – 2034), in billions
Source: KNG Health analysis of Standard Analytic File (SAF).
Cost Sharing Savings: Past and Future
In addition to generating savings for the Medicare program, performing procedures in ASCs rather than HOPDs is expected to generate savings for FFS beneficiaries. Medicare pays 80% of the cost and the beneficiary is responsible for the remaining 20%. The beneficiary may have other insurance to cover co-pays such as Medigap and other third-party insurers. The cost sharing estimate is based on the combined savings to the beneficiary, Medigap, and other third-party insurers. During the six-year period from 2019 to 2024, cost sharing savings in FFS Medicare is estimated to be $6.9 billion. Total savings grew 14.4%, from $1.1 billion in 2019 to $1.3 billion in 2024. Beginning in 2025, the projected savings from providing services in an ASC rather than a HOPD are expected to increase each year on average by 9.3% until 2034 (Figure 5). Over the course of 10 years, FFS Medicare beneficiaries are expected to save $21.2 billion in total.
Figure 5: Total Historical and Projected Cost Sharing Savings in FFS (2019 – 2034), in billions
Source: KNG Health analysis of Standard Analytic File (SAF).
Migration of New Services to ASCs
Five types of surgeries (cataract surgeries, colonoscopies, total knee replacements (TKR), cardiac catheterizations, and percutaneous laminectomies) account for 38.0% ($10.6 billion) of total savings from 2019 – 2024. They also account for 35.7% ($30.3 billion) of total projected savings from 2025 – 2034. Cardiac catheterization and percutaneous laminectomy each have a historical savings total of $0.06 billion and are projected to have over a tenfold increase over the ten-year period (Figure 6).
Figure 6. Total Historical and Projected Savings for Specified CPTs in FFS (2019 – 2034), in billions
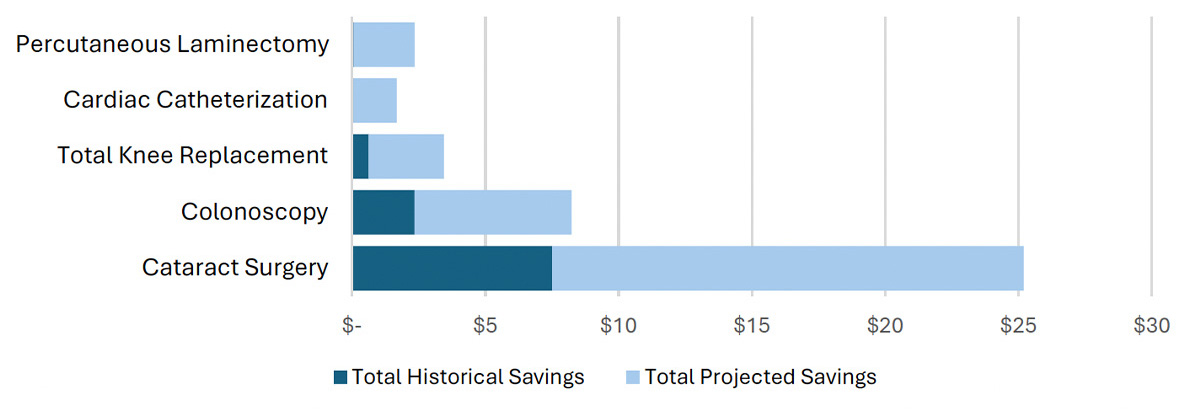
Source: KNG Health analysis of Standard Analytic File (SAF) and ASC Addendum AA
Savings from 2019 to 2024 grew for most CPT groups. Savings for the musculoskeletal CPT group saw a notable increase of 75.7%, from $0.4 billion in 2019 to $0.8 billion in 2024. This growth is largely attributable to Medicare's addition of total knee replacement (otherwise known as total knee arthroplasty) in calendar year (CY) 2020 to the ASC Covered Procedures List (Figure 7).10
Figure 7. Historical Savings for Musculoskeletal System Procedures in FFS (2019 – 2024), in millions
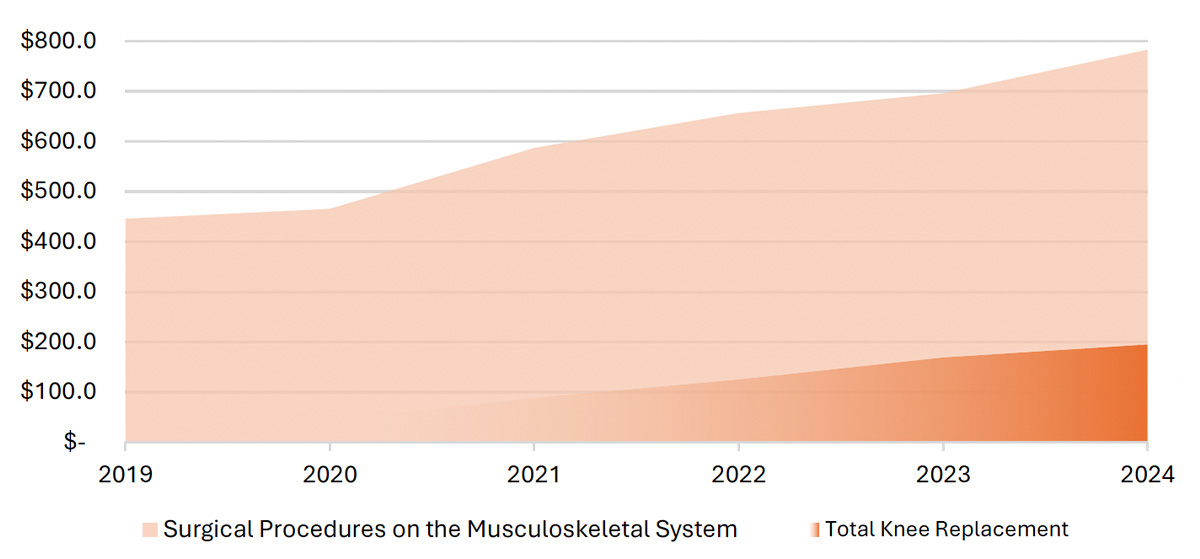
Source: KNG Health analysis of Standard Analytic File (SAF) and ASC Addendum AA.
Note: Total knee replacement was added to the ASC Covered Procedures List in 2020 under the CY 2020 OPPS-ASC Final Rule. Total knee replacement ASC volume starts 2020 onwards.
Given the current surgeries approved by CMS, we expect to see continued growth, particularly in these new areas. As new surgeries are introduced into the ASC payment system, it will be important to revisit the analysis to better refine the savings estimate.
Results: ASC Share in MA vs. FFS
Overall ASC Share
In 2023, 31.3% of ASC-eligible procedures among MA beneficiaries were performed in ASCs, compared to 31.9% among FFS beneficiaries, indicating similar levels of ASC utilization in MA and FFS. Similar patterns were observed in 2022: ASC share was 31.6% in MA and 31.7% in FFS.
ASC Share by Age
ASC utilization varied by age group, with similar patterns observed in both MA and FFS. ASC share was the highest among beneficiaries aged 65-84 and lower among those under age 65 and those age 85 and older.
Differences of ASC shares between MA and FFS within age groups were minimal, generally within one percentage point.
Detailed results by age group are provided in Appendix Table 3.
ASC Share by Dual Eligible Status
Among dual-eligible beneficiaries, ASC share was slightly higher in MA than FFS across most age groups, with differences of around 1-2 percentage points. An exception was among beneficiaries aged 85 and older–ASC utilization was nearly identical between the two payment systems (Figure 8).
Among non-dual beneficiaries, ASC share was similar between MA and FFS across the majority of age groups. For beneficiaries under 65, however, ASC utilization was modestly lower among MA than in FFS (Figure 9).
Figure 8: ASC Share by Age and Payment Type Among Dual-Eligible Beneficiaries (2023)
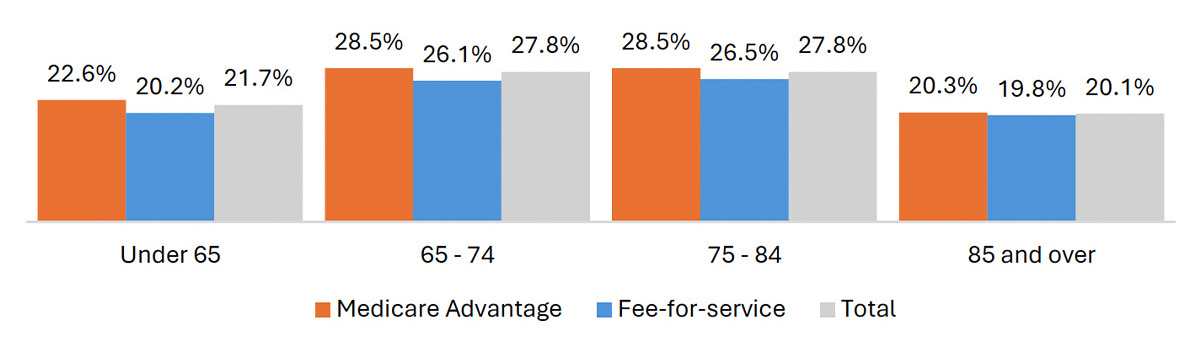
Source: KNG Health analysis of MA Encounter Data, Standard Analytic File (SAF), and the Medicare Beneficiary Summary File (MBSF).
Figure 9: ASC Share by Age and Payment Type Among Non-Dual Beneficiaries (2023)
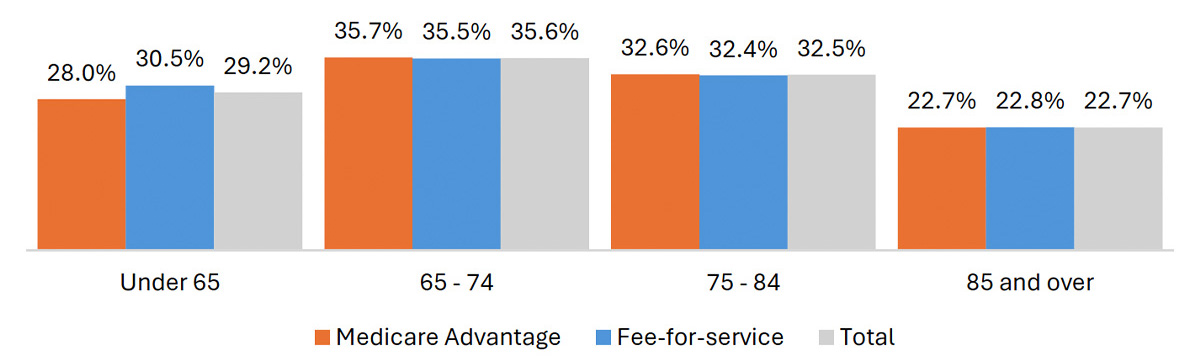
Source: KNG Health analysis of MA Encounter Data, Standard Analytic File (SAF), and the Medicare Beneficiary Summary File (MBSF).
ASC Share by Procedure Category
ASC utilization varied substantially across procedure categories in both MA and FFS. In general, differences in ASC share were more substantial between procedure groupings than between payment systems.
Eye and ocular procedures had the highest ASC shares in both payment systems, with more than 70% of procedures performed in ASCs in 2023. Digestive and nervous system procedures had moderate ASC shares, with roughly 40% of procedures performed in ASCs.
Several other procedure categories had substantially lower ASC utilization. For example, musculoskeletal procedures had ASC shares around 19% in both MA and FFS, while cardiovascular procedures were closer to 9%.
Across most procedure categories, differences in ASC utilization between MA and FFS were modest. In some categories, such as musculoskeletal and cardiovascular procedures, ASC share was slightly higher among MA beneficiaries. In others, including digestive and nervous system procedures, ASC share was somewhat higher among FFS beneficiaries. Overall, variation across procedure categories was much larger than differences between the two payment systems.
Figure 10: ASC Share by Procedure Category in MA and FFS (2023)
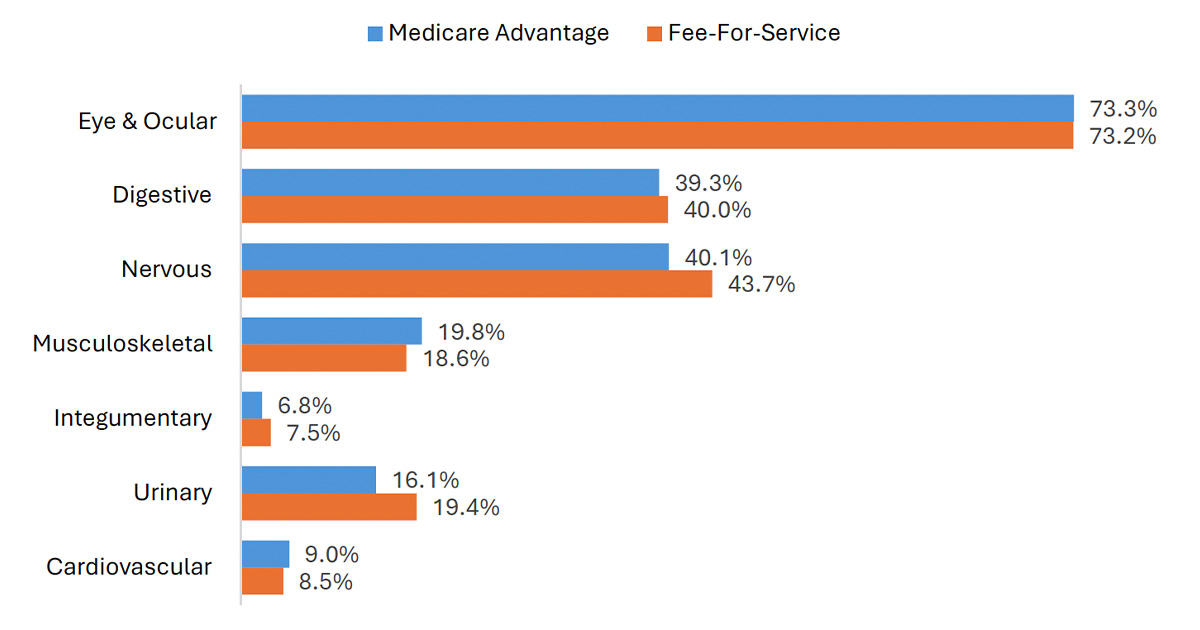
Source: KNG Health analysis of MA Encounter Data and Standard Analytic File (SAF).
Discussion
The Medicare program, which covered over 67 million Americans in 2024, is funded by the Hospital Insurance Trust Fund, which is expected to become insolvent in 2033. Medicare expenditures accounted for 3.8% of gross domestic product (GDP) in 2024 and are projected to grow to 6.2% by 2049. While the supplementary Medical Insurance Trust Fund, which funds Medicare Parts B and D, is expected to be financed in the short term, annual growth of Part B and Part D costs has continued to outpace the broader economy. Parts B and D had an annual growth rate of 8.4% over the last 5 years compared to the GDP growth rate of 6.1% in the same time period.11
The findings of this analysis show that ASCs provide considerable savings to the Medicare program. Absent any additional policy changes, ASCs are expected to provide more than $12 billion in annual savings to the Medicare program by 2034. Policymakers can protect the Medicare Trust Fund and extend Medicare solvency by prioritizing payment policies that encourage the migration of appropriate procedures to ASCs, where comparable procedures can be delivered at a lower cost.
Medicare Payment Policy Changes
The greater the disparity between the reimbursement rates for HOPDs and ASCs, the greater the potential savings to the Medicare program and beneficiaries, in the form of out-of-pocket spending. While the differential in reimbursement rates may be appropriate given cost differences across settings, low reimbursement rates for ASCs may disincentivize providers from performing appropriate services in ASCs. Low payments for ASC care may create a hurdle for Medicare cost-containment and impact patients, taxpayers, and the Medicare program. While ASCs were once paid approximately 85% of the HOPD rate, that figure now is roughly around 62%. Policymakers have made incremental changes to support additional ASC adoption, such as the ASC payment system rate updates and expanding the list of ASC-covered procedures (e.g., adding total knee replacement).
Prior to 2019, the annual inflationary updates to the ASC payment system were made using the Consumer Price Index for All Urban Consumers (CPI-U). The CPI-U tracks price changes that are largely unrelated to healthcare. In contrast, HOPD payments are updated based on the hospital market basket index, which tracks prices for surgery-related expenses, such as health worker wages and medical equipment and supplies. In general, consumer prices inflate more slowly than health care goods and services; therefore, ASCs received smaller annual updates despite having cost structures roughly aligned with HOPDs.
In the 2019 hospital Outpatient Prospective Payment System and Ambulatory Surgical Center Payment System (OPPS/ASC) Final Rule, a five-year trial period from 2019 to 2023 was instituted for ASC payments to be updated using the hospital market basket while CMS gathers data to make a permanent decision. In the 2024 OPPS/ASC Final Rule, CMS extended this policy for an additional two years, through 2025.12 For 2026, CMS finalized a payment update of 2.6% based on the hospital market basket.12 Our analysis assumes that ASC payments revert to CPI-U–based updates following the expiration of the policy. CMS could permanently align the updated indices of ASCs to HOPDs to prevent further widening of reimbursement differences.
Strengths and Limitations
This analysis provides evidence of savings from use of ASCs based on an analysis of actual Medicare claims data, including volume and reimbursement rates. Building on the previous report, we utilized actual average payments made by the Medicare program at the HCPCS level based on claim paid amounts. Future projections incorporated HCPCS-specific assumptions of the growth of outpatient volume and ASC shares based on historical trends. We stratified baseline volume for each HCPCS code by age, gender, and race to more accurately match variations in the population groups as projected by census data and the Medicare Board of Trustees.
Our analysis assume that historical trends will continue in the future. However, historical trends do not account for changes in site-of-service settings due to, for example, additional shifts in inpatient procedures to outpatient settings and expansion of the ASC procedure list. In addition, future savings projections are calculated by extending the HCPCS-level average annual exponential growth rate seen in the period from 2019 to 2024. While we excluded the 2020 decline, reliance on a historical growth rate may overstate future savings, particularly for procedures with recent high growth in volume. The analysis also projects savings for several category III CPT codes. These codes could have a substantially different savings impact once they are converted to category I status. Finally, the analysis does not consider procedures that have been approved for ASC payment after 2024.
A limitation of this analysis is the assumption that outpatient procedure volume does not depend on availability of a procedure in the ASC setting. In practice, the increased accessibility provided by ASCs may induce higher total services volumes. Such an increase would suggest that our savings estimates are overstated. Previous research has found mixed results on the impact of ASC availability of total volume growth, with one study finding a positive association of the number of ASCs with rates of colonoscopy but no statistically positive effect for other services.13 It is important to note that higher utilization of high-value services, such as colonoscopy, may also represent a positive shift in beneficiary care that provides value beyond simple cost-avoidance.
For our comparison of ASC shares in FFS and MA, limitations include completeness of the MA data. ASC services may be underreported in MA encounter files, which could result in underestimation.14 In addition, differences in how ASCs are categorized in FFS claims versus MA encounter data may also contribute to measurement differences between the two payment systems.
Conclusions
ASCs continue to offer substantial savings to the Medicare program. Annual savings from procedures performed in ASCs rather than HOPDs have been estimated at more than $3 billion per year since 2011. A large part of the program's savings since 2011 is attributable to a group of high-volume procedures, including cataract surgery, colonoscopy, total knee replacement, cardiac catheterization, and percutaneous laminectomy.
Medicare savings due to ASCs in the period of 2025-2034 are projected at $84.8 billion, driving by continued specialties of cataract surgery and growing specialties of total knee replacement, cardiac catheterization, and percutaneous laminectomy.
The alignment of ASC utilization across both MA and FFS populations is surprising and may highlight an opportunity for MA plans to enhance value-based care initiatives. Given the distinct reimbursement models, it is expected MA plans would leverage ASCs as a cost-saving mechanism. Since ASC shares are similar across both cohorts, there appears to be room for expanded utilization, where clinical appropriate and aligned with patient safety.
Appendix A: Full Methodology
Data Sources
| Data Source |
How the information was used |
| 2019-2024 5% Carrier Standard Analytic File (SAF) |
Identification of ASC claims |
| 2019-2024 5% Outpatient SAF |
Identification of HOPD claims |
| 2019-2024 Master Beneficiary Summary File |
Identification of the number of FFS and MA Medicare beneficiaries |
| ASC Payment Rates – Addenda |
Identification of valid Healthcare Common Procedure Coding System (HCPCS) codes paid under the ASC payment system |
| OPPS Payment Addendum B |
Identification of valid HCPCS codes paid under the OPPS |
| 2025 – 2034 Census Bureau National Population Projections Datasets15 |
Count of the population estimates from 2025 to 2034 |
| 2024 American Community Survey16 |
Identification of state and county population levels |
| 2025 Medicare Board of Trustees Annual Report17 |
Estimate of the total number of Medicare beneficiaries from 2025 to 2034 |
| 2025 Medicare Advantage Penetration Rate from Center for Medicare & Medicaid Services (CMS) |
Estimate the breakdown between MA and FFS Medicare beneficiaries from 2024 to 2033 |
| 2024 – 2034 Urban Consumer Price Index (UCPI)3 |
Inflation adjust the 2024 ASC payments. |
| 2024 - 2034 CMS Inpatient Hospital Market Basket Index (IHMBI)3 |
Inflation adjust the 2024 HOPD and ASC payments. |
Past Savings
For each year from 2019 to 2024, we estimated the past ASC savings for each procedure among FFS enrollees as:
Where:
When estimating past savings under FFS Medicare, we used Medicare claims data to examine volume of procedures performed at ASCs from 2019 to 2024.
ASC Volume
To estimate ASC volume for each procedure, we identified ASC claims in the 2019 to 2024 Carrier SAF using the following criteria:
- Provider specialty code=49
- Type of service code=F
- Place of service code=24
We conducted our analysis among FFS beneficiaries that had one of the Medicare-Approved ASC Surgical Procedure HCPCS codes. For each year from 2019 to 2024, we calculated the total ASC volume by procedure using the identified ASC claims. Since we used 5% Carrier SAF, we calculated the volume and multiplied by 20 to obtain the total (100%) ASC volume per procedure.
Savings per Procedure
For each procedure, the savings were estimated using the difference between HOPD payment and ASC payment.
We identified HOPD claims in 2019 to 2024 Outpatient SAF by the following criteria:
- A Hospital Claim identified by Facility type=1.
- Not an emergency department (ED) visit claim. ED visits were identified by revenue center codes 0450-0459, and 0981.
- Not an observation stay claim. Observation stays were identified by the presence of revenue codes 0760 (general classification category) or 0762 (observation room) AND the presence of HCPCS code G0378 (hospital observation service, per hour) or G0379 (direct admission of patient for hospital observation care).
We used the Medicare payments for each HCPCS procedure at the line/revenue level and obtained the average payment for each HCPCS for ASC and HOPD. We used the average payments from the claims data instead of merging in the reimbursement rates from the ASC Addendum AA or Hospital Outpatient Prospective Payment System Addendum directly, to account for the complexity of ASC and HOPD bundle payment structures.
Cost-Sharing Estimates
Most of the savings in this report are savings realized to the Medicare program. For Part B services, Medicare typically pays 80% of the total allowed amount and beneficiaries or non-Medicare coverage pays the remaining 20%. Cost-sharing savings are calculated as 20% of total savings (i.e., savings for FFS beneficiaries and third-party payers offering supplemental coverage). In 2023, most FFS beneficiaries have supplemental coverage from a third-party payer that would completely or partially cover cost-sharing (e.g., FFS + Medigap, FFS + employer-sponsored insurance, FFS + Medicaid).18
HCPCS Reclassification
To more accurately represent the Cardiovascular Surgery CPT group, the following HCPCS are grouped under the Cardiovascular CPT, rather than the classification under AAPC. Under AAPC, these classifications are categorized under "Medicine Services and Procedures," "Category III Codes," and "Other CPT Group". The following HCPCS codes were adjusted:
| HCPCS |
Short Descriptor |
| 92920 |
Prq cardiac angioplast 1 art |
| 92924 |
Prq card angio/athrect 1 art |
| 92928 |
Prq card stent w/angio 1 vsl |
| 92930 |
Prq tcat plmt ntrac st 2+les |
| 92933 |
Prq trlml c athrc st angiop1 |
| 92937 |
Prq revasc byp graft 1 vsl |
| 92943 |
Prq trluml revsc ch occ ant |
| 92945 |
Prq trl rvs ch occ ant&rtrgr |
| 92960 |
Cardioversion electric ext |
| 93451 |
Right heart cath |
| 93452 |
Left hrt cath w/ventrclgrphy |
| 93453 |
R&l hrt cath w/ventriclgrphy |
| 93454 |
Coronary artery angio s&i |
| 93455 |
Coronary art/grft angio s&i |
| 93456 |
R hrt coronary artery angio |
| 93457 |
R hrt art/grft angio |
| 93458 |
L hrt artery/ventricle angio |
| 93459 |
L hrt art/grft angio |
| 93460 |
R&l hrt art/ventricle angio |
| 93461 |
R&l hrt art/ventricle angio |
| 93620 |
Electrophysiology evaluation |
| 93650 |
Ablate heart dysrhythm focus |
| 93653 |
Ep & ablate supravent arrhyt |
| 93654 |
Ep & ablate ventric tachy |
| 93656 |
Tx atrial fib pulm vein isol |
| 0408T |
Insj/rplc cardiac modulj sys |
| C9600 |
Perc drug-el cor stent sing |
Future Savings
In general, we will project ASC savings in FFS Medicare for each procedure as:
Where:
The projection of ASC savings required assumptions regarding the growth of outpatient surgical volume per enrollee, MA penetration rates, and ASC share of outpatient surgeries. We used 2024 surgical volume and ASC share of procedures as the baseline.
To inform the future savings, we estimated growth of ASC procedures by projecting the growth of Medicare beneficiaries, the growth of surgical procedures, and the growth of ASC market share for FFS beneficiaries. To estimate the number of FFS beneficiaries, we projected by estimating the growth in total Medicare enrollment minus the growth in Medicare Advantage enrollment. The growth in surgical procedures was projected by multiplying the projected number of FFS beneficiaries by the share of FFS beneficiaries with an outpatient visit multiplied by the growth in ASC market share.
The growth in the share of FFS beneficiaries with an outpatient visit and the growth in the ASC market share was calculated by dividing the 2024 share by the 2019 share and then taken to the power of 1/5. This is calculating the average annual growth per year between 2019 and 2024. This excluded 2020 from the growth rate calculation to minimize the impacts of the COVID-19 pandemic. The growth rates were calculated on the HCPCS level first, and the CPT level if HCPCS data were missing for one or both years. The projected ASC market share was capped between 0.2% and 88.6%, which represents the top and bottom one percentile 2024 ASC market share.
In the estimate of total savings, the total ASC and HOPD spending were estimated by inflating the 2024 spending for each setting using either the CMS Inpatient Hospital Market Basket Index or Urban Consumer Price Index. To reflect the current spending, HOPD spending was inflated by multiplying the 2024 HOPD spending by the growth in the IHMBI for 2025 to 2034. ASC spending was inflated by multiplying the 2024 ASC spending by the growth in the IHMBI for 2025 and 2026, and then the UCPI for 2027 to 2034. The total savings were calculated as the difference between the sum of the HOPD payments and the sum of the ASC payments.
Medicare Advantage Comparison
Data Sources
We used MA encounter files and Medicare FFS claims data to identify the site of service (ASC vs. HOPD) for procedures performed among Medicare beneficiaries. CMS Addendum AA was used to identify valid ASC-covered procedures – those eligible for payment when performed in an ASC under the ASC prospective payment system. The Medicare Beneficiary Summary File (MBSF) was used to determine the beneficiaries' dual eligible status at the time of the service.
Identification of ASC and HOPD Service
Procedures were classified by site of service using information available in Medicare claims and encounter data.
Identification of HOPD services was consistent across MA and FFS data and used place-of-service indicator codes.
Identification of ASC services differed slightly between MA and FFS due to differences in variable availability. In the MA data, ASCs were identified using place-of-service indicators. In the FFS data, ASCs were identified using a combination of place-of-service indicators, provider specialty codes, and type of service codes.
Procedures that could not be reliably identified as ASC or HOPD were excluded from the analysis.
Identification of ASC-Eligible Procedures
We identified eligible procedures using the 2022 and 2023 ASC Covered Procedure List (CMS Addendum AA), which specifies HCPCS codes eligible for payment under the prospective payment system when performed in an ASC. The ASC procedure list was applied regardless of whether the procedure occurred in an ASC or HOPD. Because HOPDs can perform a wider range of procedures than ASCs, this approach ensures comparisons are limited to procedures that could be performed in either care setting and supports a consistent, policy-relevant comparison of ASC vs. HOPD utilization.
To accurately account for multiple procedures that occurred on the same day of service, procedure modifiers were used to ensure procedures were counted appropriately.
Outcome Measure Calculation (ASC Share)
The primary measure was the share of procedures performed in ASCs, defined as the number of procedures performed in ASCs divided by the total number of procedures performed in ASCs and HOPDs.
Results were reported for CY 2022 and 2023 and stratified by age group, dual eligible status, and procedure category.
Appendix B: Tables
Table B1: Total Past Savings by CPT Group (2011 – 2024), in millions
| CPT Group |
Prior Time Period |
Current Time Period |
| 2011 |
2012 |
2013 |
2014 |
2015 |
2016 |
2017 |
2018 |
2019 |
2020 |
2021 |
2022 |
2023 |
2024 |
| Eye and Ocular Adnexa |
$1,253.2 |
$1,259.7 |
$1,379.7 |
$1,424.6 |
$1,445.3 |
$1,415.1 |
$1,512.8 |
$1,645.1 |
$1,678.9 |
$1,436.7 |
$1,706.6 |
$1,848.2 |
$1,826.3 |
$1,832.3 |
| Musculoskeletal System |
$404.6 |
$393.6 |
$431.9 |
$432.4 |
$439.7 |
$397.1 |
$355.7 |
$408.7 |
$445.4 |
$465.7 |
$586.7 |
$656.2 |
$695.6 |
$782.7 |
| Digestive System |
$526.7 |
$520.4 |
$573.6 |
$606.4 |
$649.6 |
$626.3 |
$659.1 |
$737.4 |
$777.1 |
$640.7 |
$776.7 |
$771.5 |
$762.3 |
$765.4 |
| Nervous System |
$410.0 |
$426.6 |
$493.5 |
$534.8 |
$560.3 |
$595.8 |
$553.1 |
$583.9 |
$690.6 |
$637.8 |
$681.6 |
$686.7 |
$617.9 |
$712.0 |
| Cardiovascular System1 |
$22.9 |
$26.1 |
$29.7 |
$33.0 |
$32.2 |
$59.5 |
$143.3 |
$213.3 |
$280.3 |
$233.6 |
$248.7 |
$280.0 |
$334.0 |
| Urinary System |
$104.7 |
$104.8 |
$112.0 |
$124.3 |
$130.5 |
$129.9 |
$136.1 |
$152.5 |
$149.9 |
$147.0 |
$166.2 |
$162.8 |
$181.2 |
$185.5 |
| Other CPT Group2 |
$72.3 |
$78.2 |
$92.3 |
$102.3 |
$106.6 |
$116.6 |
$106.5 |
$126.2 |
$138.2 |
$116.2 |
$138.6 |
$143.2 |
$140.1 |
$160.3 |
| Integumentary System |
$194.4 |
$199.1 |
$190.2 |
$188.0 |
$195.4 |
$212.5 |
$158.9 |
$160.4 |
$172.5 |
$126.0 |
$141.8 |
$141.4 |
$151.8 |
$137.6 |
| Respiratory System |
$82.8 |
$83.3 |
$97.3 |
$110.0 |
$111.6 |
$103.4 |
$38.6 |
$62.6 |
$58.7 |
$50.8 |
$51.7 |
$53.8 |
$60.3 |
$59.1 |
| Male Genital System |
$20.8 |
$17.7 |
$19.2 |
$19.1 |
$23.8 |
$24.2 |
$29.4 |
$32.4 |
$34.8 |
$35.7 |
$39.8 |
$40.7 |
$42.4 |
$52.9 |
| Auditory System |
$10.9 |
$10.7 |
$10.6 |
$13.3 |
$13.4 |
$12.5 |
$7.6 |
$10.4 |
$11.3 |
$11.2 |
$10.6 |
$11.9 |
$9.8 |
$21.7 |
| Category III Codes3 |
$5.9 |
$6.1 |
$19.6 |
$20.2 |
$36.4 |
$55.5 |
$35.5 |
$59.2 |
$59.2 |
$56.9 |
$74.8 |
$25.0 |
$38.3 |
$21.3 |
| Female Genital System |
$14.1 |
$11.2 |
$12.4 |
$11.8 |
$11.0 |
$8.3 |
$10.1 |
$11.1 |
$10.0 |
$9.7 |
$13.4 |
$16.4 |
$13.6 |
$14.9 |
| Hemic and Lymphatic Systems |
$3.5 |
$3.4 |
$4.3 |
$4.5 |
$6.5 |
$3.5 |
$14.3 |
$13.6 |
$13.5 |
$11.5 |
$14.5 |
$14.1 |
$12.9 |
$14.7 |
| Endocrine System |
$0.3 |
$0.5 |
$0.6 |
$1.3 |
$1.6 |
$2.4 |
$2.4 |
$2.9 |
$3.4 |
$4.3 |
$3.7 |
$3.2 |
$4.7 |
$5.4 |
| General Surgical Procedures |
$0.0 |
$0.0 |
$0.0 |
$0.0 |
$0.0 |
$0.0 |
$0.0 |
$0.0 |
$0.0 |
$0.2 |
$0.1 |
$0.1 |
$0.1 |
$0.1 |
| Medicine Services and Procedures4 |
— |
— |
— |
— |
— |
— |
— |
— |
$0.0 |
$0.1 |
$0.1 |
$0.1 |
$0.0 |
$0.1 |
| Surgical Procedures for Maternity Care and Delivery5 |
$0.0 |
$0.1 |
$0.1 |
$0.1 |
$0.0 |
$0.2 |
$0.0 |
$0.1 |
$0.2 |
$0.0 |
$0.1 |
$0.1 |
$0.1 |
$0.0 |
| Operating Microscope Procedures |
$0.0 |
$0.0 |
$0.0 |
$0.1 |
$0.0 |
$0.0 |
$0.0 |
$0.0 |
$0.0 |
$0.0 |
$0.0 |
$0.0 |
$0.0 |
$0.0 |
| Other Surgery6 |
$0.1 |
$0.1 |
$0.0 |
$0.1 |
$0.1 |
$0.2 |
$0.3 |
$0.1 |
— |
— |
— |
— |
— |
— |
| Total Savings |
$3,128.5 |
$3,138.7 |
$3,463.5 |
$3,623.0 |
$3,765.0 |
$3,735.7 |
$3,679.9 |
$4,150.1 |
$4,457.0 |
$4,030.7 |
$4,640.5 |
$4,824.1 |
$4,837.5 |
$5,100.1 |
Source: KNG Health Analysis of Standard Analytic File (SAF) and ASC Addenda AA.
Footnotes:
- A list of HCPCS reclassified under the CPT for "Surgical Procedures on the Cardiovascular System" are provided in the "Appendix A: Full Methodology." These HCPCS previously were classified under "Medicine Services and Procedures," "Category III Codes," and "Other CPT Group" under AAPC - but based on feedback it was determined Cardiovascular was a more appropriate CPT classification.
- The HCPCS range for "Other CPT Group" is likely different between reports due to differences in HCPCS included for CPT group.
- The HCPCS range for "Category III Codes" in the prior report was 0042T-0593T, the classification has been updated to include the expanded list of HCPCS codes 0042T-1025T.
- The CPT grouping for "Medicine Services and Procedures" was not reported in the prior report.
- In 2024, there was no reported ASC or HOPD volume for the three HCPCS that are captured under "Surgical Procedures for Maternity Care and Delivery." The three HCPCS captured from 2019 to 2023 were: (1) 59812 - treatment of miscarriage; (2) 59841 - abortion; and (3) 59820 - care of miscarriage. We believe that this can be attributed to the reauthorization of the Hyde Amendment which restricts federal abortion funding in Medicare. See more here: https://www.kff.org/womens-health-policy/the-hyde-amendment-and-coverage-for-abortion-services-under-medicaid-in-the-post-roe-era/.
- The CPT grouping for "Other Surgery" (i.e., in the HCPCS range of 10004-69990 not already classified by a surgical grouping) does not occur in the current year's report.
Table B2: Total Future Savings by CPT Group (2025 – 2034), in millions
| CPT Group |
2025 |
2026 |
2027 |
2028 |
2029 |
2030 |
2031 |
2032 |
2033 |
2034 |
| Eye and Ocular Adnexa |
$2,041.8 |
$2,148.7 |
$2,305.6 |
$2,444.0 |
$2,584.4 |
$2,721.6 |
$2,860.6 |
$3,004.0 |
$3,178.6 |
$3,386.9 |
| Musculoskeletal System |
$846.2 |
$908.8 |
$1,024.8 |
$1,127.4 |
$1,229.0 |
$1,350.3 |
$1,485.8 |
$1,637.5 |
$1,824.7 |
$2,054.8 |
| Digestive System |
$821.7 |
$858.8 |
$918.0 |
$968.9 |
$1,022.1 |
$1,081.2 |
$1,141.5 |
$1,202.0 |
$1,273.7 |
$1,357.4 |
| Nervous System |
$785.3 |
$826.1 |
$912.2 |
$985.8 |
$1,069.6 |
$1,174.1 |
$1,301.6 |
$1,451.3 |
$1,650.4 |
$1,919.8 |
| Cardiovascular System1 |
$390.3 |
$448.3 |
$544.4 |
$668.5 |
$805.8 |
$953.0 |
$1,127.5 |
$1,291.5 |
$1,418.8 |
$1,569.0 |
| Urinary System |
$208.7 |
$227.4 |
$253.7 |
$281.6 |
$313.4 |
$352.2 |
$397.7 |
$448.9 |
$512.1 |
$582.4 |
| Other CPT Group2 |
$181.3 |
$190.5 |
$204.1 |
$215.6 |
$227.2 |
$239.5 |
$251.4 |
$262.8 |
$275.8 |
$290.6 |
| Integumentary System |
$145.6 |
$150.6 |
$159.0 |
$166.3 |
$174.0 |
$182.1 |
$188.9 |
$195.5 |
$203.3 |
$212.3 |
| Respiratory System |
$58.6 |
$60.6 |
$64.3 |
$67.2 |
$70.2 |
$73.5 |
$76.8 |
$79.9 |
$83.6 |
$87.7 |
| Male Genital System |
$58.3 |
$63.9 |
$71.8 |
$79.1 |
$86.9 |
$95.4 |
$106.5 |
$120.0 |
$136.1 |
$152.9 |
| Auditory System |
$22.1 |
$24.8 |
$28.9 |
$33.4 |
$38.7 |
$45.3 |
$53.1 |
$62.5 |
$74.2 |
$88.5 |
| Category III Codes3 |
$30.3 |
$42.0 |
$61.6 |
$86.4 |
$121.7 |
$173.5 |
$247.2 |
$352.1 |
$505.4 |
$727.5 |
| Female Genital System |
$14.8 |
$15.6 |
$17.0 |
$18.3 |
$19.6 |
$21.2 |
$23.0 |
$25.0 |
$27.5 |
$30.5 |
| Hemic and Lymphatic Systems |
$15.2 |
$15.9 |
$16.8 |
$17.8 |
$18.8 |
$20.1 |
$21.4 |
$22.7 |
$24.4 |
$26.5 |
| Endocrine System |
$5.5 |
$6.1 |
$6.9 |
$7.6 |
$8.5 |
$9.5 |
$10.7 |
$11.9 |
$13.3 |
$15.0 |
| General Surgical Procedures |
$0.1 |
$0.2 |
$0.3 |
$0.3 |
$0.5 |
$0.6 |
$0.9 |
$1.2 |
$1.6 |
$2.1 |
| Medicine Services and Procedures4 |
$0.1 |
$0.1 |
$0.1 |
$0.2 |
$0.2 |
$0.3 |
$0.3 |
$0.4 |
$0.5 |
$0.6 |
| Surgical Procedures for Maternity Care and Delivery5 |
$0.0 |
$0.0 |
$0.0 |
$0.0 |
$0.0 |
$0.0 |
$0.0 |
$0.0 |
$0.0 |
$0.0 |
| Operating Microscope Procedures |
$0.0 |
$0.0 |
$0.0 |
$0.0 |
$0.0 |
$0.0 |
$0.0 |
$0.0 |
$0.0 |
$0.0 |
| Total Savings |
$5,625.9 |
$5,988.6 |
$6,589.5 |
$7,168.4 |
$7,790.8 |
$8,493.4 |
$9,294.8 |
$10,169.2 |
$11,204.0 |
$12,504.5 |
Source: KNG Health Analysis of Standard Analytic File (SAF) and ASC Addenda AA.
Footnotes:
- A list of HCPCS reclassified under the CPT for "Surgical Procedures on the Cardiovascular System" are provided in the "Appendix A: Full Methodology." These HCPCS previously were classified under "Medicine Services and Procedures," "Category III Codes," and "Other CPT Group" under AAPC - but based on feedback it was determined Cardiovascular was a more appropriate CPT classification.
- The HCPCS range for "Other CPT Group" is likely different between reports due to differences in HCPCS included for CPT group.
- The HCPCS range for "Category III Codes" in the prior report was 0042T-0593T, the classification has been updated to include the expanded list of HCPCS codes 0042T-1025T.
- The CPT grouping for "Medicine Services and Procedures" was not reported in the prior report.
- In 2024, there was no reported ASC or HOPD volume for the three HCPCS that are captured under "Surgical Procedures for Maternity Care and Delivery." The three HCPCS captured from 2019 to 2023 were: (1) 59812 - treatment of miscarriage; (2) 59841 - abortion; and (3) 59820 - care of miscarriage. We believe that this can be attributed to the reauthorization of the Hyde Amendment which restricts federal abortion funding in Medicare. See more here: https://www.kff.org/womens-health-policy/the-hyde-amendment-and-coverage-for-abortion-services-under-medicaid-in-the-post-roe-era/.
Table B3: ASC Share in MA by Age and Dual Eligibility Status (2022 – 2023)
| Medicare Advantage |
Fee-for-Service |
| 2022 |
2023 |
2022 |
2023 |
| Dual |
Non-Dual |
Dual |
Non-Dual |
Dual |
Non-Dual |
Dual |
Non-Dual |
| <65 |
23.4% |
28.0% |
22.6% |
28.0% |
20.1% |
29.6% |
20.2% |
30.5% |
| 65-74 |
28.4% |
36.0% |
28.5% |
35.7% |
25.6% |
35.3% |
26.1% |
35.5% |
| 75-84 |
29.7% |
32.6% |
28.5% |
32.6% |
26.7% |
32.3% |
26.5% |
32.4% |
| >85 |
20.7% |
23.1% |
20.3% |
22.7% |
19.5% |
23.3% |
19.8% |
22.8% |
Source: KNG Health analysis of MA Encounter Data and Standard Analytic File (SAF).
Table B4: ASC Share in MA versus FFS by CPT Group (2022 – 2023)
| Medicare Advantage |
Fee-For-Service |
| 2022 |
2023 |
2022 |
2023 |
| Share |
Count |
Share |
Count |
Share |
Count |
Share |
Count |
| Eye and Ocular Adnexa |
73.1% |
1,849,660 |
73.3% |
2,075,380 |
72.2% |
1,943,380 |
73.2% |
1,947,840 |
| Digestive System |
39.6% |
1,743,860 |
39.3% |
1,922,560 |
39.9% |
1,838,780 |
40.0% |
1,832,080 |
| Nervous System |
39.8% |
1,217,980 |
40.1% |
1,398,640 |
42.0% |
1,450,620 |
43.7% |
1,489,540 |
| Musculoskeletal System |
19.9% |
474,680 |
19.8% |
546,140 |
18.5% |
573,360 |
18.6% |
598,280 |
| Other CPT Group |
53.4% |
215,760 |
51.7% |
244,720 |
61.7% |
355,420 |
61.0% |
357,940 |
| Integumentary System |
7.0% |
182,660 |
6.8% |
203,260 |
8.0% |
253,500 |
7.5% |
241,340 |
| Urinary System |
16.0% |
142,660 |
16.1% |
160,820 |
18.1% |
189,220 |
19.4% |
205,040 |
| Cardiovascular System1 |
7.3% |
105,680 |
9.0% |
146,800 |
7.4% |
110,720 |
8.5% |
121,860 |
| Respiratory System |
10.0% |
56,340 |
9.3% |
63,540 |
12.3% |
66,140 |
12.1% |
69,260 |
| Male Genital System |
24.1% |
28,740 |
25.5% |
36,740 |
24.4% |
34,360 |
26.9% |
39,440 |
| Category III Codes |
55.5% |
8,840 |
46.7% |
10,900 |
71.7% |
13,300 |
72.0% |
18,600 |
| Female Genital System |
6.2% |
14,040 |
5.5% |
13,920 |
6.3% |
13,960 |
6.1% |
12,980 |
| Auditory System |
7.4% |
7,920 |
7.3% |
9,240 |
6.8% |
9,200 |
7.1% |
10,620 |
| Medicine Services and Procedures |
1.7% |
1,220 |
1.8% |
2,480 |
1.5% |
1,320 |
0.7% |
880 |
| Hemic and Lymphatic Systems |
4.2% |
10,340 |
3.5% |
9,800 |
3.3% |
8,440 |
2.9% |
7,260 |
| Endocrine System |
6.2% |
1,740 |
5.1% |
1,660 |
3.4% |
1,280 |
4.8% |
1,740 |
| Operating Microscope Procedures |
15.5% |
1,240 |
17.1% |
1,100 |
5.5% |
600 |
5.3% |
460 |
| General Surgical Procedures |
0.4% |
320 |
0.3% |
340 |
0.3% |
260 |
0.3% |
240 |
| Surgical Procedures for Maternity Care and Delivery2 |
0.4% |
N<220 |
0.7% |
N<220 |
37.5% |
N<220 |
15.4% |
N<220 |
| Reproductive System Procedures |
0.0% |
0 |
0.0% |
0 |
0.0% |
0 |
0.0% |
0 |
Source: KNG Health analysis of MA Encounter Data and Standard Analytic File (SAF).
Footnotes:
- A list of HCPCS reclassified under the CPT for "Surgical Procedures on the Cardiovascular System" are provided in the "Appendix A: Full Methodology." These HCPCS previously were classified under "Medicine Services and Procedures," "Category III Codes," and "Other CPT Group" under AAPC - but based on feedback it was determined Cardiovascular was a more appropriate CPT classification.
- Cell counts are suppressed for small sample sizes. Consistent with CMS cell suppression guidelines (typically N<11), counts in this analysis are suppressed at N<220 to account for the use of a 5% sample (scaled by a factor of 20).
Table B5: CPT Group and HCPCS Ranges
| CPT Group |
HCPCS Range |
| Eye and Ocular Adnexa |
65091-68899 |
| Musculoskeletal System |
20100-29999 |
| Digestive System |
40490-49999 |
| Nervous System |
61000-64999 |
| Cardiovascular System |
33016-37799 |
| Urinary System |
50010-53899 |
| Other CPT Group |
Other HCPCS Range |
| Integumentary System |
10030-19499 |
| Respiratory System |
30000-32999 |
| Male Genital System |
54000-55899 |
| Medicine Services and Procedures |
90281-99607 |
| Auditory System |
69000-69979 |
| Category III Codes |
0042T-1025T |
| Female Genital System |
56405-58999 |
| Hemic and Lymphatic Systems |
38100-38999 |
| Endocrine System |
60000-60699 |
| General Surgical Procedures |
10004-10021 |
| Surgical Procedures for Maternity Care and Delivery |
59000-59899 |
| Operating Microscope Procedures |
69990 |